Home Energy
With the current situation of rising electricity costs I decided to track my energy usage a bit closer. I roughly calculated it once and thought my homelab should approximately cost 100 CHF per year. But since I am a big fan of Grafana dashboards, I just had to go in this direction.
For starters, I want to measure the office, my server room and the home entertainment system. “Server room” may sound serious, but it is just a closet with 2 pc’s, a Raspberry Pi, a printer and a switch. About the rest of our household I don’t feel too guilty of drawing too much energy…
Sensors
I had this idea quite some time ago, but always failed to find appropriate cheap sensors for this use case. Finally, I found sensors I liked, the Shelly Plug S (see https://shop.shelly.cloud/shelly-plug-s-wifi-smart-home-automation#62). For the price of 16.9 Euro, it came with all the features I needed and more. One is not forced to use their cloud. It provides the MQTT protocol, but if activated it disables the cloud monitoring, which is exactly what I wanted…
MQTT » Mosquitto » NodeRed » InfluxDB
I decided to use Mosquitto as the message broker, NodeRed as the ETL (Extract Transform Load) and InfluxDB as the database. There are good documentations, howto’s and even YouTube guides how to set these things up, so I don’t want to replicate that here. I just offer my docker-compose file for this stack:
version: '3.1'

volumes:
  mosquitto_data:
  mosquitto_log:
  mosquitto_conf:
  node_red_data:
  influx_home_automation:
    external: true # nfs-share from my NAS

services:
  mosquitto:
    image: eclipse-mosquitto
    container_name: mosquitto
    restart: always
    ports:
      - 1883:1883
      - 9001:9001
    volumes:
      - mosquitto_conf:/mosquitto/config
      - mosquitto_data:/mosquitto/data
      - mosquitto_log:/mosquitto/log

  node-red:
    image: nodered/node-red
    container_name: node-red
    restart: always
    network_mode: host  #this necessary because UDP broadcasts (for WoL)
                        #are not properly routed through docker networks
    ports:
      - 1880:1880
    depends_on:
      - mosquitto
    volumes:
      - node_red_data:/data
    environment:
      - TZ=Europe/Zurich

  influxdb:
    image: influxdb:1.8
    container_name: influxdb
    restart: always
    ports:
      - 8086:8086
    volumes:
      - influx_home_automation:/var/lib/influxdb
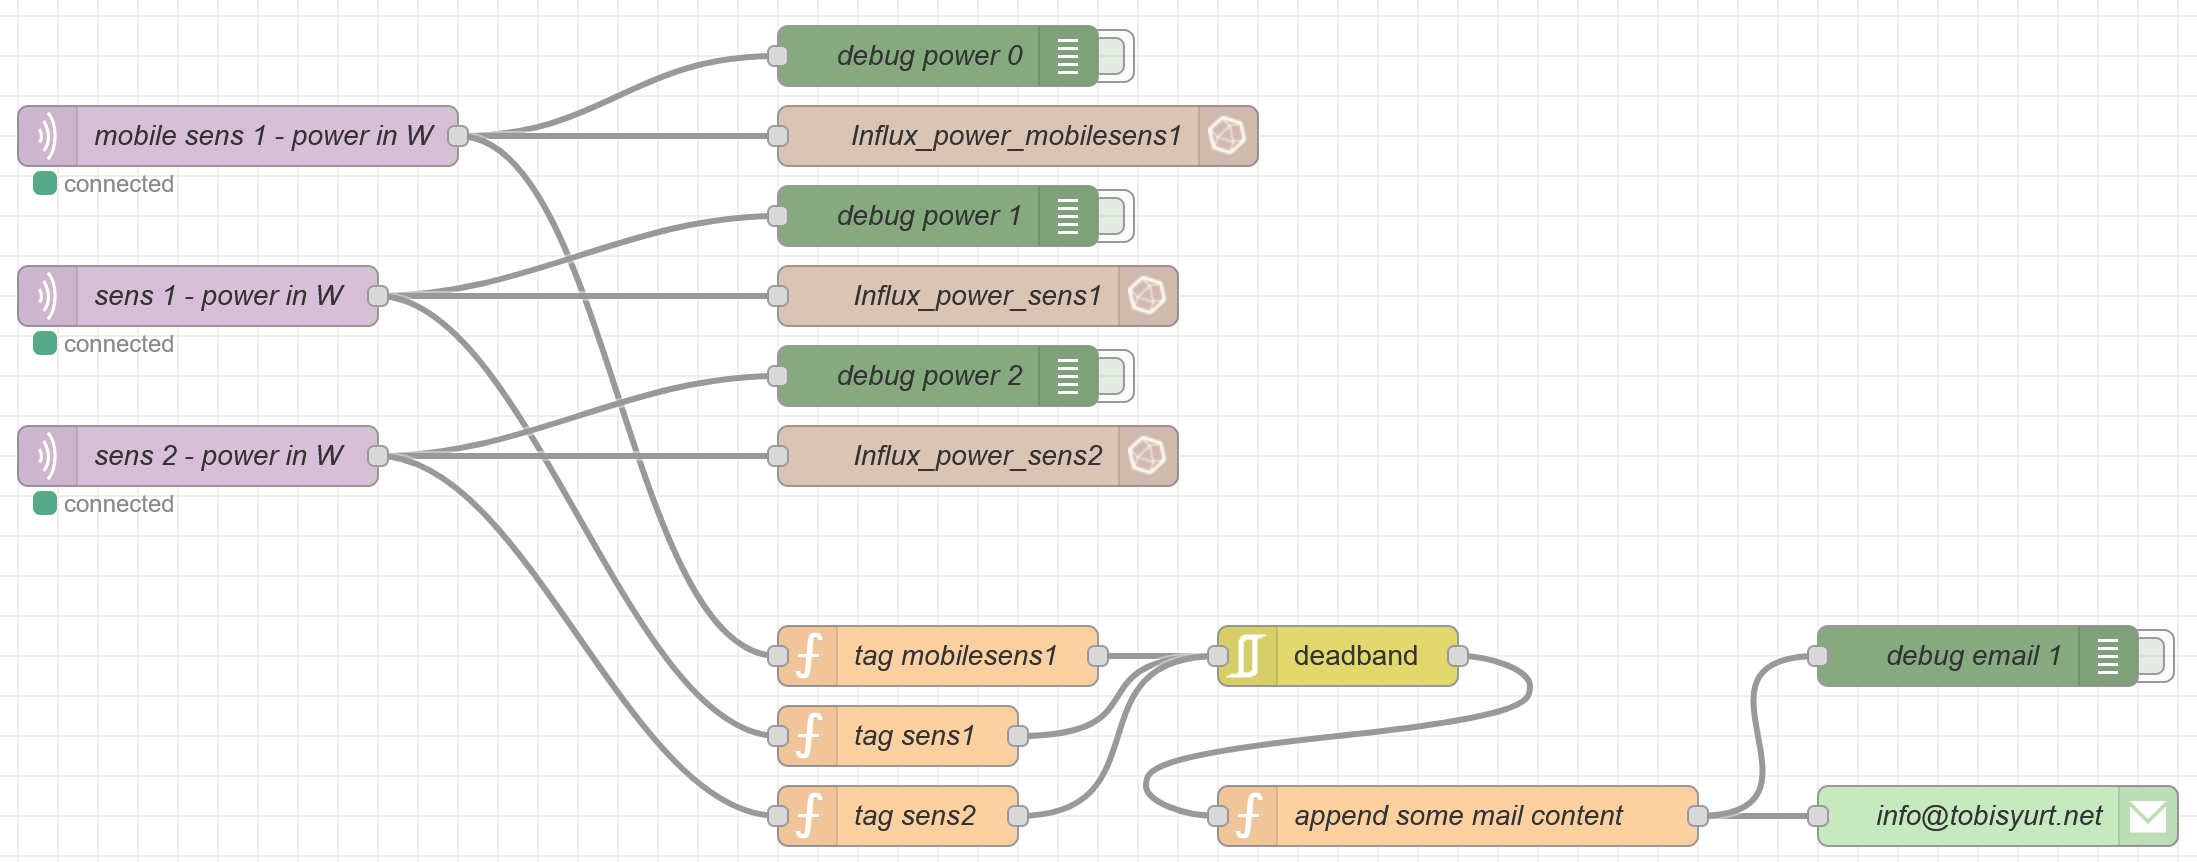
I can highly recommend NodeRed. It was the first time I used it and got quickly motivated to do more stuff. There are plenty of nodes available and give many possibilities for automation tasks. Examples of mine:
- Mail alerts, if big power fluctuations
- Start / stop devices with WoL (Wake on Lan) / API-Calls with a simple dashboard
- more to come …
Here my NodeRed flow for the extraction of the power measurements:
Grafana Dashboard
Finally, the funny part starts. Grafana is also very well documented, but I did not find proper step-by-step guides for people, who are completely new to Grafana. That’s why I wanted to describe that part a little more. If one has not the patience to build his own dashboard, there is always many available to download here.
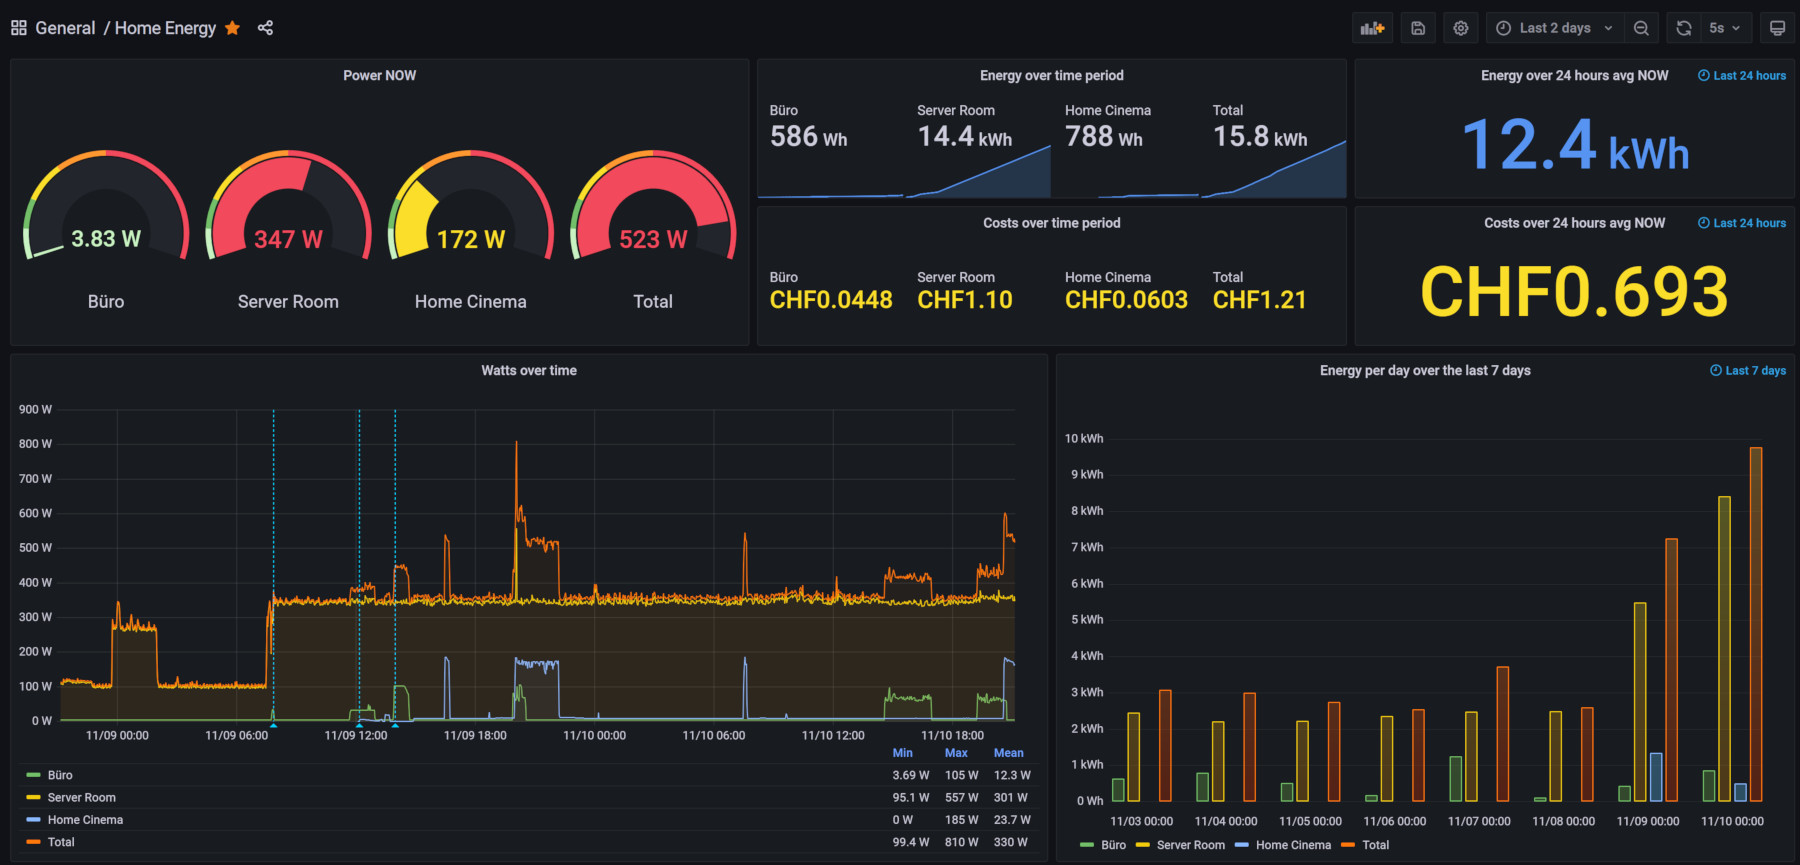
Here is what I have accomplished and what I want to explain a little. You can get the dashboard
here).
A simpler query?
Let’s assume that the InfluxDB is running and has some metrics to query. The easiest Graph is probably the one
in the top left corner with the cauges visualisation. It is showing the most actual power measurement per metric in the
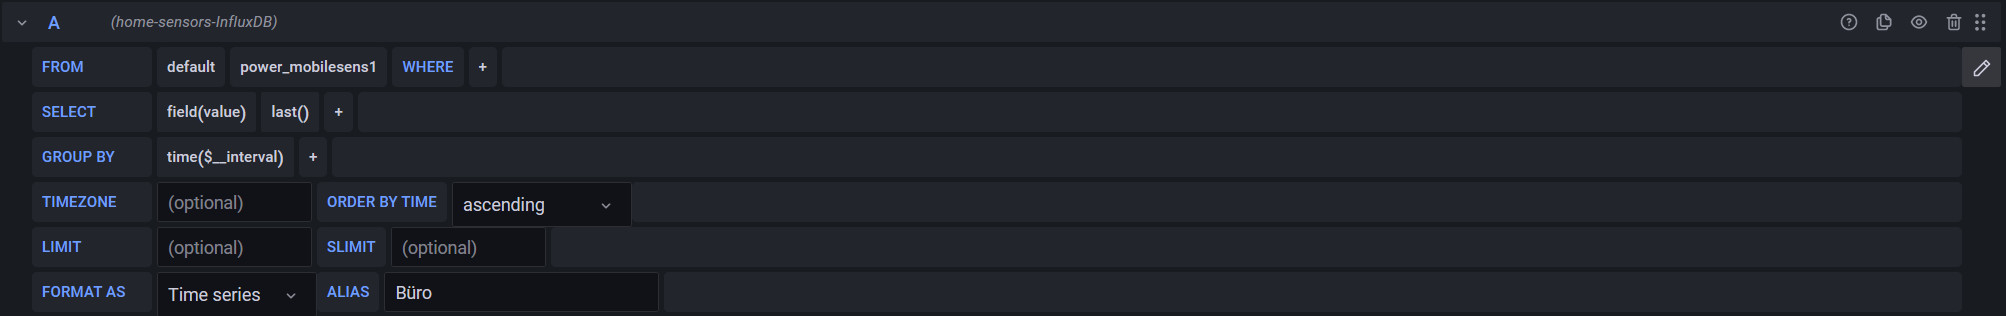
database. The query has not to do anything fancy, just to pull the last value per measurement. Therefore, theoretically
no grouping is necessary, but I also wanted to calculate the total with the transform option, which somehow needs a
common time and this is provided by the grouping. The last() selector takes care of delivering only the last measured
value in the time range. With the Grafana built-in query builder it looks like that:
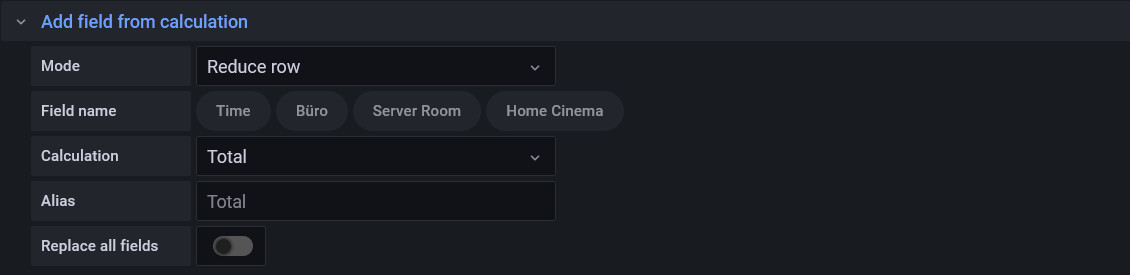
To add multiple metrics just replicate above query accordingly. Then to add a total like I did with clicking on the other tab called “Transform” and make it look like that:
After writing about that first query, I figured it is not as simple as I thought…
A more complex query
I skip the simple line graph underneath the cauges, because the query is what Grafana proposes by default.
The power consumption over time (stat visualisation) in the top middle section was the most complicated thing to do for
me. There is also an energy measurement provided by the Shelly Plug S, but that is cumulated since the last power up of
the plug. I wanted to be able to select a specific time range and calculate the energy in Watt-hours over that
specific range only. You could also use the difference() function to use that metric, but I kind of wanted to
calculate it my self to be sure what it is doing and to have a nice resolution.
That is why I had to integrate the power measurement. I grouped the power measurement over 10 seconds (1 hour would be
easier but less accurate), took the mean values, summed these up and divided by 60 * 6 = 360 to get hours. 6 because;
6 * 10s = 1 min and 60 * 1 min = 1 h (if one takes 1h in the group by you can skip that math).
I think this would also work if you are producing Energy somehow, making sure producing results in negative values.
The query looks as follows then:
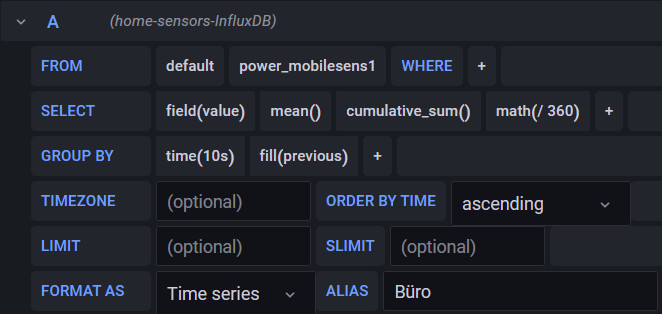
The total I added in the same way as in the simple query. On the right side of the editor you can always play around with options of the visualisation you have chosen, which provides a big degree of individualisation.
Let me know in the comments if you are interested in Grafana or if you know better approaches to have the same results I wanted.