Modsecurity Nginx
At work, I had the task to prepare a low-cost production environment for a project in Kenya. It also required a WAF (Web Application Firewall), just as a precaution and to be able to react as fast as possible to the newest vulnerabilities in our technology stack. We decided to go for mod_security 2 on a classic Apache reverse proxy.
This got me motivated to secure my public websites served from my homelab. In general, I think WAF’s are overrated and especially overpriced, but in certain scenarios it makes a lot of sense to install an open source solution. In my opinion it makes sense, if:
- For whatever reason the web app has a slow release cycle and is hard to update fast (e.g. regulation jungle)
- You serve apps, where you have limited abilities to change something (closed source, developed externally)
- Older webapps, which do not get updated, but you still want to use them…
In my homelab I have some apps under category 2. and 3., what lead me to tackle this.
NGINX Reverse Proxy
I already had a NGINX web server configured as my reverse proxy. That is why I decided to go with the new version 3 of ModSecurity1 which also provides a NGINX-Connector. Previous versions were dependent of the Apache web server, but luckily the major upgrade of version 3 made it standalone with several connectors to various Web Servers.
ModSecurity
I will summarize the necessary steps, because it can be different depending on th OS and I did it in a FreeBSD Jail, which is not the easiest way (had to build NGINX from scratch, because the default NGINX web server in the FreeBSD package repository misses some dependencies).
- install / build necessary nginx modules:
- MODSECURITY3
- HTTP_IP2LOCATION (optional if you want to use the GeoLite2City/Country db’s)
- install Libmodsecurity
- get the OWASP Coreroleset I recommend not to take the dev track.
- activate it where ever you want and learn to handle false positives
Grafana Dashboard
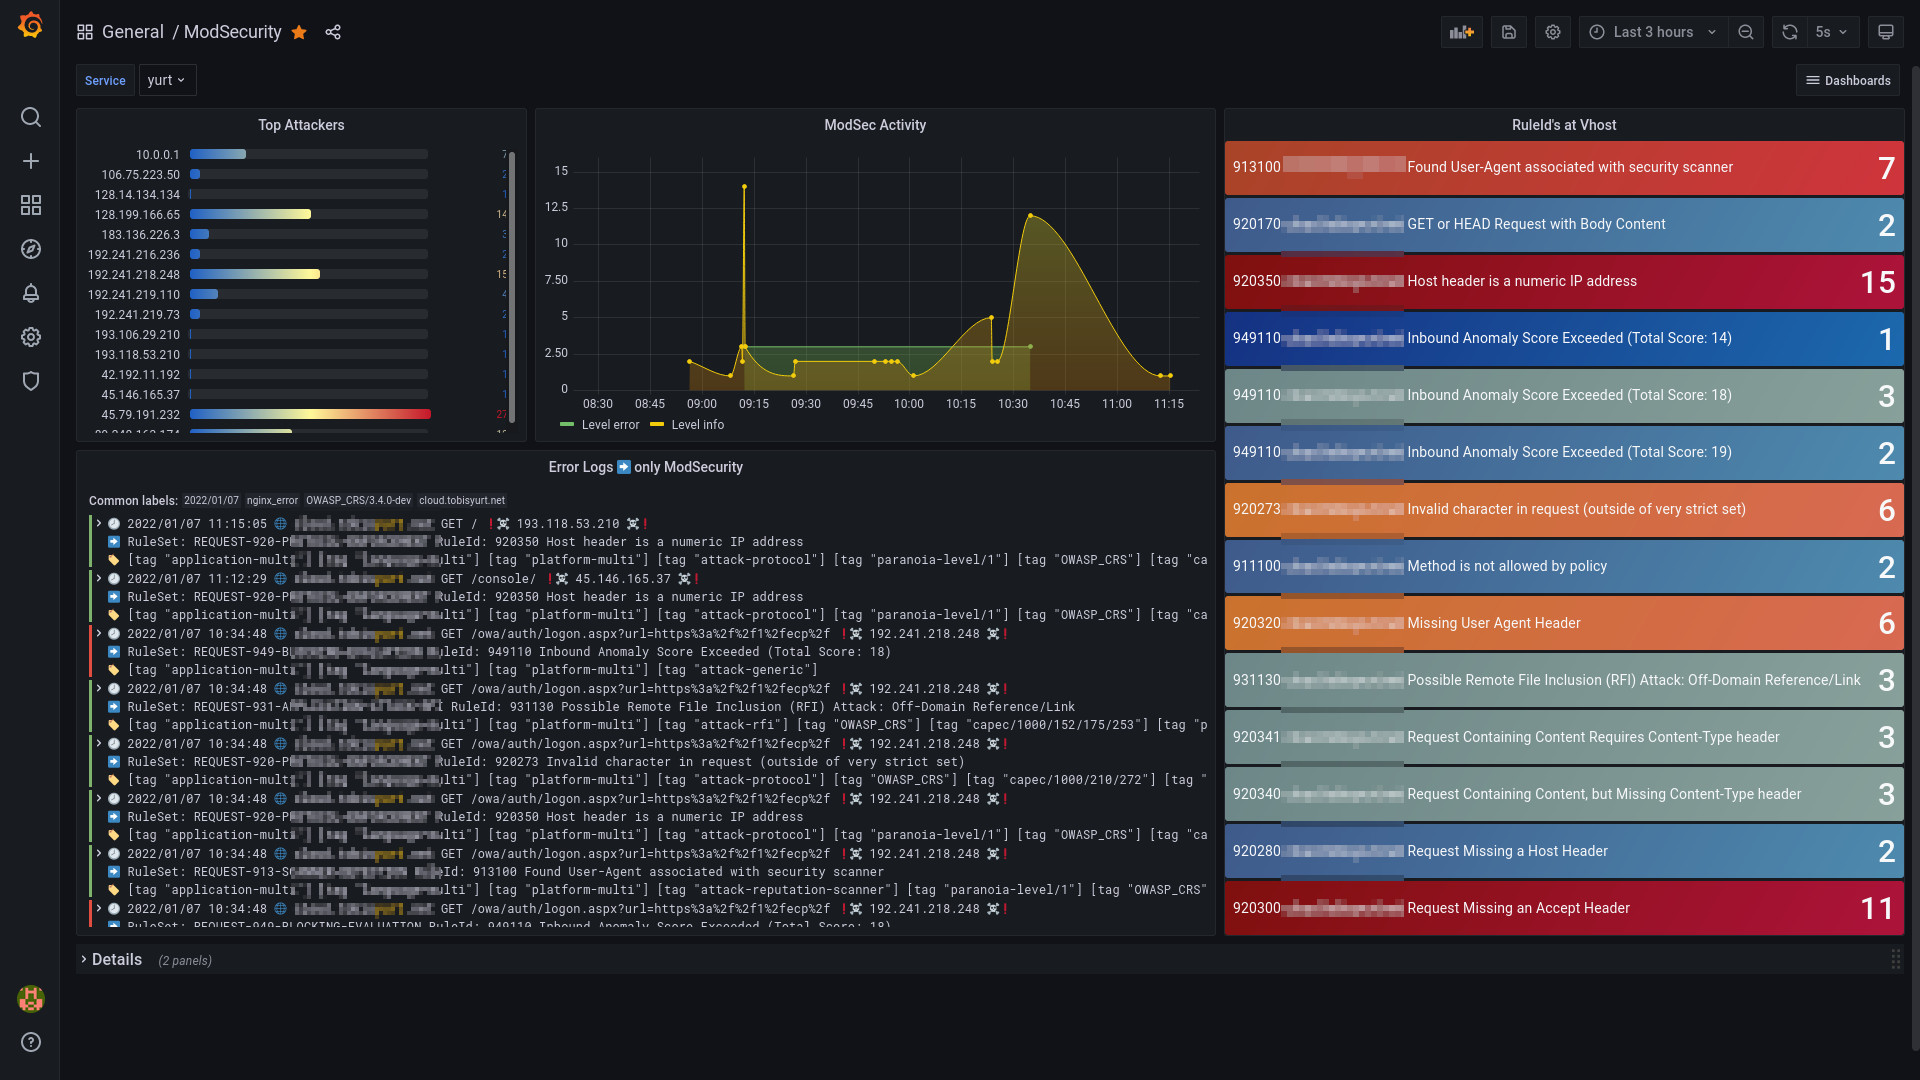
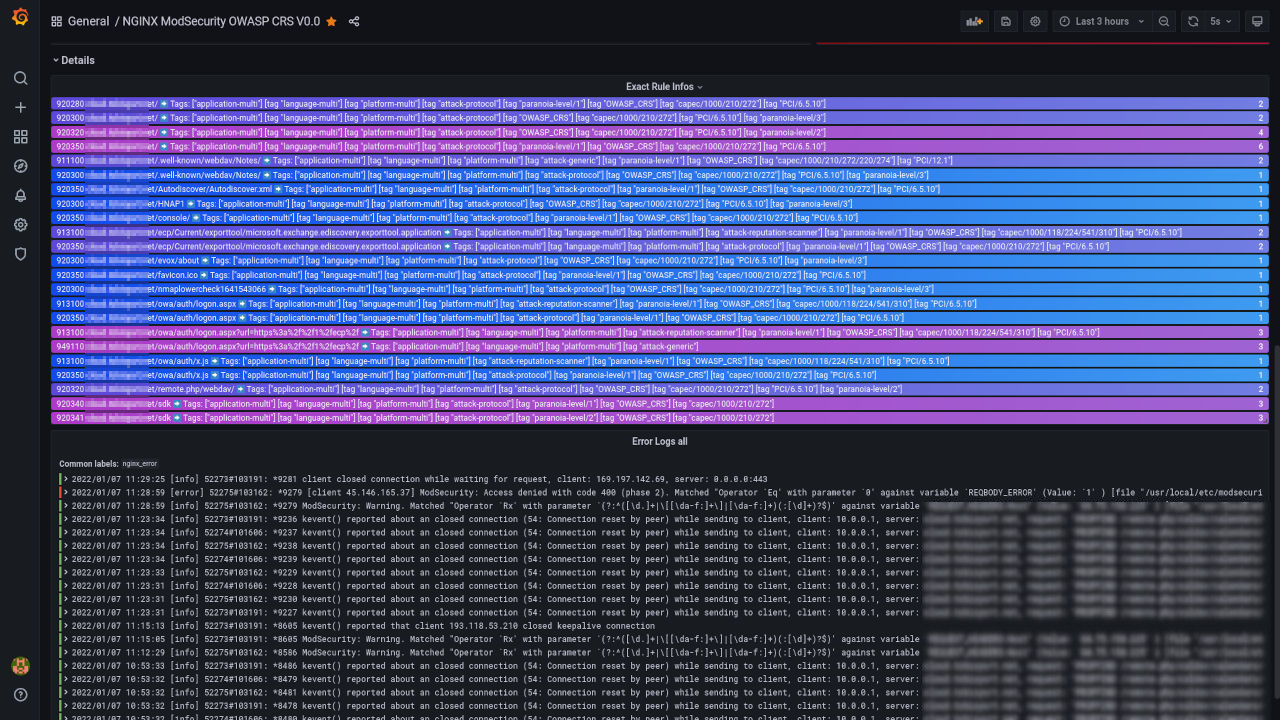
I like logs, but I love visualizations! I set up a grafana instance to monitor my reverse proxy’s access logs before and added a new dashboard for the modsecurity messages in the error log. Maybe there will follow another post on Grafana related stuff.
But if you are interested in the dashboard itself, I shared it here.

